The Value of Economic Value
When reviewing Interest Rate Risk (IRR) results, the natural tendency is to focus on the Earnings-At-Risk (EaR) results. The concept is straight forward: An income statement forecast of 12 and 24 months outlining the impact of market rate movement. Though the forecast does incorporate the assumption that all balances remain static throughout the 12 and 24 month projection, it provides insight that can be considered for discussions about pricing and margin. However, once the conversation shifts to Economic Value of Equity (EVE) results the focus often shifts to a compliance mindset. What makes EVE more difficult to engage with and how can management get more out of the assessment?
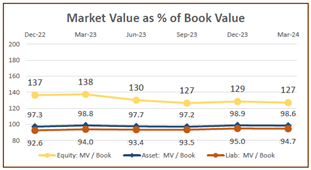
The first hesitation around EVE is how the “valuation” is derived and what it represents. As one banker asked, “Are you saying that this is the value of my bank?” The answer is… it’s A valuation, but it is not the same as a bank’s stock valuation. Economic value focuses on tangible asset and liability holdings and puts them in the context of a market. However, equity value is very dependent on Non-Maturity Deposit (NMD) valuation, and this value is derived with as much assumption as fact. There’s no denying that NMDs provide a tremendous funding value for banks, but they are not structured to easily value nor is there a market for a context. The result is that the resulting EVE can feel more contrived then concrete. So how should management view the EVE value? First, ensure you get comfortable with the composition of the number and what it represents. Once you have this, then the focus forward can be on watching for changes and trends of the number. This can be done with the EVE ratio or monitoring the Market Value to Book Value relationship (see graph).
Material shifts in these measures indicate a risk change in your holdings, which can be caused by concentration change, additions or subtractions, and market changes. It is typically a combination of all of these and you should understand why it is happening. EVE is able to reflect dormant risk within your balance sheet, which is something that a 12-month or 24-month income risk forecast cannot do.
This ties into another banker’s question, “Back in early 2022, where were ALM models warning us of the risk we’re now facing with our investment portfolio?” The answer – the information was present in your EVE report. But to be fair, it didn’t show up very well if management was only looking at the summary EVE measures. As noted previously, EVE is a ‘net’ number. Back in 2022 when the +300 and +400 shock results were reflected, the reporting did reflect investments losing value for most banks. But also reflected was a significant improvement in value of the inexpensive funding on the balance sheet. As a ‘net’ number, EVE percentage changes didn’t fully show the exposure building to a liquidity resource. This is the second recommendation when assessing your EVE. Examination of valuation changes should be looked at within the portfolio to ID risk, focusing especially on areas where risk may have to be realized. For investments and loans, this is the risk of loss from liquidation or their value related to pledging capabilities. A good measure is viewing it in the context of capital exposure.
One more reason EVE is questioned is because it often seems to conflict with the message you get from the EaR results. “My EVE reflects we face greater risk when rates rise, but my EaR reflects that it’s to my benefit when rates rise. Which one is right?” Most banks see this in their IRR reporting, and both measures are correct. Basically, the risk measures are looking at two different risks: The risk of holding what you have and the risk of things changing. For many banks, a rising rate environment will show loss of value via EVE as asset value loss outweighs funding value gains. It’s about reassessing what you have today (think in terms of the investment portfolio). However in the next year or two, higher market rates may allow you to reprice out of where you are today resulting in better income and margin. Or the risk that your pricing and structure may result in repricing that is out of balance and not in your favor. Two different measures for two distinct risks. So how can management address EVE more effectively? We find that changing the order of how you view the IRR results helps. Most IRR providers begin with economic history and forecast estimates, touch on balance sheet composition, and quickly move into EaR. This leaves EVE out of context when it’s brought up later and difficult for the ALCO to process. Change the discussion to first discussing the balance sheet shifts and what the EVE risk assessment reflects. Then bring up economic forecasts to address where the balance sheet risk could likely be. Once this is understood, you can move into EaR results. How income will change with current pricing and rate sheets, and the shock results if rates shift more or less than expected. EVE will have been addressed in the right context, and the ALCO will find ending with EaR easier to process.
Both EVE and EaR have a place in the overall risk assessment. While EVE can seem like a measure that is not as easy to interpret, it provides significant insight in the overall bank risk position that EaR alone cannot provide.